Continuing our Replication Monitoring series, this fourth installment explores how to surface a couple metrics that highlight ongoing replication errors. Our goal is simple: provide immediate visibility into where failures are occurring so that DBAs can intervene at the correct point in the pipeline to begin their investigation.
While we are focusing specifically on Transactional Replication (though these principles may apply to Merge and Snapshot as well), there are two primary “moving parts” in the data flow: 1) Reading from the Publisher 2) Applying changes to the Subscriber
Admittedly, this is a simplified view of replication’s inner components. However, at a high level, these tasks are handled by the Log Reader Agent and the Distribution Agent, respectively. Under healthy conditions, both processes run continuously. If they encounter a critical error, their associated SQL Server Agent jobs will either stop entirely or enter a “retrying” state.
Focusing on these two processes is the most effective starting point for troubleshooting. In fact, Microsoft’s own documentation suggests asking these fundamental questions to kickstart any investigation:
- Where in the synchronization process is replication failing?
- Which agent is experiencing the error?
- When was the last time replication worked successfully, and what has changed since then?
The first two questions are the most critical for a DBA. By identifying which “major part” is broken and which specific SQL Agent job is failing, you can significantly reduce your mean time to resolution (MTTR). The last question is always helpful so we can ask questions on what changed around the time the replication broke.
Tracking Log Reader Agent errors
For Log Reader Agent job issues, we can locate error-related information in either the distribution or msdb databases. To check the distribution database, we can run the query below to obtain details regarding the agent’s run state and any logged “comments”:
;with cte as (
	select agent_id, max(start_time) max_start_time
	from MSlogreader_history
	group by agent_id
)
select
	rs.srvname Publisher,
	la.publisher_db PublisherDb,
	la.name LogReaderAgent,
	lh.comments
from MSlogreader_history lh
join cte c on lh.agent_id = c.agent_id
	and lh.start_time = c.max_start_time
join MSlogreader_agents la on lh.agent_id = la.id
join MSreplservers rs on la.publisher_id = rs.srvid
where lh.runstatus in (5, 6) -- retry and fail respectully
The primary issue with the MSlogreader_history table is that it does not update in real time when the Log Reader Agent is in a ‘retry’ or ‘failed’ state. For example, I intentionally triggered a retry state by introducing a typo into the database name; however, the MSlogreader_history table has yet to reflect any errors or status changes.

Only after the Log Reader Agent completes a series of retries (typically 10) will the results finally appear in the MSlogreader_history table. This delay is unacceptable for real-time monitoring in high-volume OLTP environments. If the Log Reader isn’t running, the Publisher’s transaction log cannot be truncated, which can quickly lead to a “log full” crisis and database downtime.

Let’s shift our focus to the msdb database. We will use the dbatools PowerShell module to identify Log Reader Agents that are not functioning properly. This PowerShell approach is significantly more efficient than querying system tables (from a consumer perspective), especially when trying to decipher the actual run status of the jobs.
import-module dbatools

$distributor = 'colinshousegetout\serverb'
Get-DbaAgentJob -SqlInstance "$distributor" | Where-Object {
    $_.Category -eq "Repl-LogReader" -and
    $_.CurrentRunStatus -notin "Idle","Executing"
} | Select-Object -Property InstanceName, Name, CurrentRunStatus

We can keep things simple from here. The goal is to funnel this data into a centralized monitoring dashboard so we can observe the status of all Log Reader Agents in a single pane of glass. Following the methodology from the previous posts on replication monitoring, we will send these metrics to InfluxDB and visualize them using Grafana.
If you want to follow along but are new to these tools, check out the guide,“Getting Started with Grafana and InfluxDB,” for a step-by-step walkthrough.
# Requires -Module dbatools

# ==============================================================================
# 1. INFLUXDB 2.x CONFIGURATION
# ==============================================================================
$InfluxUrl = "http://localhost:8086/api/v2/write"
$Bucket = "sqlmonitoring"
$Org = ""
$Token = ""
$Measurement = "sql_agent_job_alerts" # Updated measurement name for clarity
# ==============================================================================
# 2. SQL SERVER & FILTER CONFIGURATION
# ==============================================================================
$distributor = ''

try {
    # Fetch the specific jobs using dbatools
    $Jobs = Get-DbaAgentJob -SqlInstance "$distributor" | Where-Object {
        $_.Category -eq "Repl-LogReader" -and
        $_.CurrentRunStatus -notin "Idle","Executing"
    } | Select-Object -Property InstanceName, Name, CurrentRunStatus, @{Name='AlertValue'; Expression={1}}

    if ($Jobs) {
        $LineProtocolBatch = New-Object System.Collections.Generic.List[string]

        foreach ($Job in $Jobs) {
            # Construct Line Protocol: measurement,tag1=val,tag2=val field=1
            # Note: Spaces in names must be escaped for InfluxDB
            $EscapedJobName = $Job.Name -replace ' ', '\ '
            $EscapedInstance = $Job.InstanceName -replace ' ', '\ '

            $Timestamp = [System.DateTimeOffset]::UtcNow.ToUnixTimeMilliseconds() * 1000000

            $Line = "$Measurement,instance=$EscapedInstance,job_name=$EscapedJobName alert_value=$($Job.AlertValue) $Timestamp"
            $LineProtocolBatch.Add($Line)
        }

        # Convert the list to a single multi-line string for the API call
        $Body = $LineProtocolBatch -join "`n"

        # Prepare Headers
        $Headers = @{
            "Authorization" = "Token $Token"
            "Content-Type"  = "text/plain"
        }

        # Construct URI and Send Data
        $FullUri = $InfluxUrl + "?bucket=$Bucket&org=$Org&precision=ns"

        Invoke-RestMethod `
            -Uri $FullUri `
            -Method Post `
            -Headers $Headers `
            -Body $Body | Out-Null

        Write-Host "SUCCESS: Sent $($LineProtocolBatch.Count) job alerts to InfluxDB."
    }
    else {
        Write-Host "INFO: No failed or stopped Log Reader jobs found."
    }
}
catch {
    Write-Error "ERROR: Failed to process metrics. Details: $($_.Exception.Message)"
}

Using the query below in Grafana as the data source, we can finally visualize which Log Reader Agent is failing on a dashboard.
from(bucket: "sqlmonitoring")
  |> range(start: v.timeRangeStart, stop: v.timeRangeStop)
  |> filter(fn: (r) => r["_measurement"] == "sql_agent_job_alerts")
  |> filter(fn: (r) => r["_field"] == "alert_value")
  |> aggregateWindow(every: v.windowPeriod, fn: last, createEmpty: true)
  |> yield(name: "last_status")

The Log Reader Agent issue was resolved at 10:02, at which point the metrics stopped flowing. In this specific setup, no incoming metrics is a positive sign—it indicates that all Log Reader Agents are running properly. We only trigger alerts and data points when an anomaly or failure is detected.
One thing to note is that the msrepl_error table also seems to hold error messages from the Log Reader Agent as well, but according to MS documentation this table should only stores information from both Distribution and Merge Agents. Due to that, we wont rely on this table for reliable information. So, use this table at your own risk for Log Reader errors.
select *
from MSrepl_errors
where time > '2026-01-18 12:00:00'
order by time desc

Track Distribution Agent Errors
The Distribution Agent system tables do a better job of providing real-time monitoring for Distribution Agent errors than the LogReader Agent system tables. By running the query below, we can extract the current Distribution Agent activity from the msdistribution_history table. We can see that the actual Distribution Agent on the Subscriber is in a retrying state, even though msdistribution_history is reporting an issue.
;with cte as (
	select agent_id, max(start_time) max_start_time
	from MSdistribution_history
	group by agent_id
)
select
	rs.srvname Publisher,
	da.subscriber_db PublisherDb,
	da.name DistributionAgent,
	dh.time,
	dh.comments
from MSdistribution_history dh
join cte c on dh.agent_id = c.agent_id
	and dh.start_time = c.max_start_time
join MSdistribution_agents da on dh.agent_id = da.id
join MSreplservers rs on da.publisher_id = rs.srvid

For our Replication Monitoring dashboard approach, we are going to focus on using the msdistribution_history table to understand where replication errors are occurring and how frequently they occur. Ideally, we want a bar graph that displays the number of errors per Distribution Agent, including the Subscriber information.
Since msdistribution_history is a log table, we need a mechanism to extract only the new errors that have occurred since the previous collection interval. To achieve this, we will create a ‘tracking’ table in the DBA database to record the last time the monitoring collection was run. We will host this tracking table on the Distributor.
create table MonitoringCollectionIntervals (
	MetricType varchar(100) not null,
	CollectionDateTime datetime NOT NULL,
	constraint pk_metrictype_subscriberserver primary key (MetricType)
)
Nothing fancy here; we simply want to store the last time we collected metrics for Distribution Agent errors from the msdistribution_history table. Each time we run the monitoring collection, we will extract the CollectionDateTime from this tracking table and use it as the lower bound to pull new errors from the system table.
declare @CollectionTime datetime = GETDATE(),
		@PreviousCollectimeTime datetime;

--seed the table if needed
if not exists (select 1 from dba.dbo.MonitoringCollectionIntervals)
begin
 insert into dba.dbo.MonitoringCollectionIntervals (MetricType, CollectionDateTime) values ('DistributionAgentErrors', '1900-01-01')
end

--get the last collection time
select
	@PreviousCollectimeTime = CollectionDateTime
from dba.dbo.MonitoringCollectionIntervals
where MetricType = 'DistributionAgentErrors'


select rs.srvname Subscriber, da.name DistributionAgent, Count(1) NumOfErrors
from MSdistribution_history dh
join MSdistribution_agents da on dh.agent_id = da.id
join MSreplservers rs on da.publisher_id = rs.srvid
where dh.time > @PreviousCollectimeTime
and dh.runstatus = 6 --fail
group by rs.srvname, da.name

update dba.dbo.MonitoringCollectionIntervals
set CollectionDateTime = @CollectionTime
where MetricType = 'DistributionAgentErrors'

Ok, good. Now we can see that this specific Distribution Agent has reported 14 errors in the msdistribution_history table since the last time the monitoring collection process ran. We ran the query again a few minutes later and found one additional reported error.

Now, let’s get this prepped for sending the metrics to InfluxDB so we can visualize them on a Grafana dashboard. Following the same approach used in other Replication Monitoring posts, here is the updated version of the script to collect and send Distribution Agent metrics to InfluxDB.
# Requires -Module dbatools

# ==============================================================================
# 1. INFLUXDB 2.x CONFIGURATION (MUST BE UPDATED)
# ==============================================================================
$InfluxUrl = "http://localhost:8086/api/v2/write"
$Bucket = "" # Must match the bucket name in your telegraf.conf
$Org = ""         # Must match the organization name in your telegraf.conf
$Token = ""
$Measurement = "sql_replication_distirbution_agent_errors"
# ==============================================================================
# 2. SQL SERVER CONFIGURATION
# ==============================================================================
$SqlInstance = "distributor server"
$distributionDbQuery = "
select name db_name
from sys.databases
where is_distributor = 1
"

$sqlQuery = "
declare @CollectionTime datetime = GETDATE(),
		@PreviousCollectimeTime datetime;

--seed the table if needed
if not exists (select 1 from dba.dbo.MonitoringCollectionIntervals)
begin
 insert into dba.dbo.MonitoringCollectionIntervals (MetricType, CollectionDateTime) values ('DistributionAgentErrors', '1900-01-01')
end

--get the last collection time
select
	@PreviousCollectimeTime = CollectionDateTime
from dba.dbo.MonitoringCollectionIntervals
where MetricType = 'DistributionAgentErrors'


select rs.srvname Subscriber, da.name DistributionAgent, Count(1) NumOfErrors
from MSdistribution_history dh
join MSdistribution_agents da on dh.agent_id = da.id
join MSreplservers rs on da.publisher_id = rs.srvid
where dh.time > @PreviousCollectimeTime
and dh.runstatus = 6 --fail
group by rs.srvname, da.name

update dba.dbo.MonitoringCollectionIntervals
set CollectionDateTime = @CollectionTime
where MetricType = 'DistributionAgentErrors'"


# ==============================================================================
# 3. SCRIPT EXECUTION AND DATA PREPARATION
# ==============================================================================
$count = 0
while ($count -lt 10000)
{
try {
    $DistributionDBs = Invoke-DbaQuery -SqlInstance $SqlInstance -Database master -Query $distributionDbQuery

    $ErrorResults = @(foreach($DistributionDB in $DistributionDBs) {
        # Execute the error tracking query against each distribution database
        Invoke-DbaQuery -SqlInstance $SqlInstance -Database $DistributionDB.db_name -Query $sqlQuery |
            Select-Object @{n='Subscriber'; e={$_.Subscriber}},
                          @{n='DistributionAgent'; e={$_.DistributionAgent}},
                          @{n='NumOfErrors'; e={$_.NumOfErrors}}
    })

    $LineProtocolBatch = @()

    # Process results and format as InfluxDB Line Protocol
    foreach ($Row in $ErrorResults) {
        # --- 1. Retrieve Values ---
        $Subscriber        = [string]$Row.Subscriber
        $DistributionAgent = [string]$Row.DistributionAgent
        $NumOfErrors       = [double]$Row.NumOfErrors

        # --- 2. Format Tags (Identifiers) ---
        # Escaping spaces and commas for InfluxDB Line Protocol consistency
        $TagSubscriber = "subscriber=" + $Subscriber.Replace(" ", "\ ").Replace(",", "\,")
        $TagAgent      = "dist_agent=" + $DistributionAgent.Replace(" ", "\ ").Replace(",", "\,")

        # Combine tags into the TagSet
        $TagSet = "$TagSubscriber,$TagAgent"

        # --- 3. Format Fields (The Measured Metric) ---
        $FieldSet = "error_count=$NumOfErrors"

        # --- 4. Timestamp ---
        $Timestamp = [System.DateTimeOffset]::UtcNow.ToUnixTimeMilliseconds() * 1000000

        # --- 5. Construct Line Protocol String ---
        $Line = "$Measurement,$TagSet $FieldSet $Timestamp"

        $LineProtocolBatch += $Line
    }


    # ==========================================================================
    # 4. HTTP API POST REQUEST TO INFLUXDB
    # ==========================================================================
    if ($LineProtocolBatch.Count -gt 0) {

        # Join all Line Protocol strings with a newline character for a single batch write
        $Body = $LineProtocolBatch -join "`n"

        # Headers for InfluxDB 2.x API write
        $Headers = @{
            "Authorization" = "Token $Token"
            "Content-Type" = "text/plain"
        }

        # --- DEBUGGING STEP ---
        # --- NEW DIAGNOSTIC LINES ---
        Write-Host "URL: $InfluxUrl"
        Write-Host "Bucket: $Bucket"
        Write-Host "Org: $Org"
        # ----------------------------

        # Inside the try block, where the URI is constructed:
        # --- DEBUGGING STEP (KEEP THIS LINE) ---

        $FullUri = $InfluxUrl + "?bucket=" + $Bucket + "&org=" + $Org + "&precision=ns"
        $FullUri
        Write-Host "DEBUG: Constructed URI is: $FullUri"

        # If the URI is invalid, output the error and stop the script early
        if ($FullUri -notmatch "^http(s)?://[^\s/$.?#].[^\s]*$") {
            Write-Error "DEBUG: URI validation FAILED for: $FullUri"
            exit 1
        }
        # --- END DEBUGGING STEP ---

        # Send the data to InfluxDB using the Write API
        Invoke-RestMethod `
            -Uri $FullUri `
            -Method Post `
            -Headers $Headers `
            -Body $Body | Out-Null

        Write-Host "SUCCESS: Sent $($LineProtocolBatch.Count) metrics to InfluxDB."
    }
    else {
        Write-Host "INFO: SQL query returned no metrics to send."
    }
}
catch {
    # Output the error to the standard error stream for robust logging
    Write-Error "CRITICAL ERROR during SQL or InfluxDB operation: $($_.Exception.Message)"
    exit 1 # Exit with non-zero code to indicate failure if run via scheduler
}
    Start-Sleep -Seconds 10
$count++
}
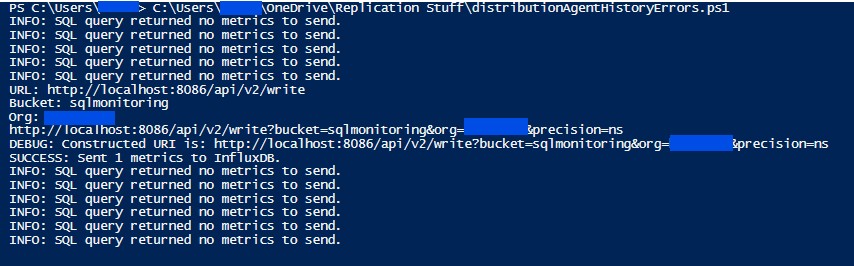
Admittedly, we can observe from the output that we are not sending metrics in near real-time—it’s more like every 60 seconds or so. After checking the msdistribution_history table below, we can see that the error for the failing Distribution Agent occurs every 60 to 75 seconds..

The alternative approach to achieving near real-time monitoring is to use the Get-DbaAgentJob PowerShell function to extract the Distribution Agent’s runtime state. However, since a replication environment can have a large number of Distribution Agents (100+), there is a potential risk of long execution times; the function would need to run once for each subscriber.
Now that the metrics are in InfluxDB, we can visualize them in Grafana. Using Gemini to assist with the syntax, here is the InfluxDB query used to plot the data points.
from(bucket: "sqlmonitoring")
  |> range(start: v.timeRangeStart, stop: v.timeRangeStop)
  |> filter(fn: (r) => r["_measurement"] == "sql_replication_distirbution_agent_errors")
  |> filter(fn: (r) => r["_field"] == "error_count")
  // 1. Set createEmpty to true to generate rows for missing intervals
  |> aggregateWindow(every: v.windowPeriod, fn: sum, createEmpty: true)
  // 2. Map the resulting null values to 0.0 so the graph is continuous
  |> fill(column: "_value", value: 0.0)
  |> yield(name: "error_totals")

Alright, great. We can now monitor the Distribution Agent errors happening across the replication environment in near real-time. In this demo, we only have one failing Distribution Agent; however, the true power of this approach lies in centralizing errors from a large-scale replication environment.
Leave a Reply